flask
httpie
requests
simplejson
botocore
scrapy
docker-compose
ansible
What are those diagrams ?
They show dependencies between the internal modules of various well-known Python libraries.
They goal is to provide a global overview of a Python project architecture, as a map of modules & packages, the top-level code abstractions.
Note that all module names in those diagrams are HTML links to the actual source code on GitHub.
Why ?
At work, we did a short technical-debt review of one of our Python services, and a co-worker reported a lack of documentation to provide a clear overview of the code structure, for first-time contributors to easily jump in.
Hence, last week I searched for some helpful code visualization recipes to provide such insight to our code base, hoping to find an easy-to-setup Python module that would do the job.
I did not find any off-the-shelf package for my need (although I'd love your suggestions if you know some !), but discovered Francois Zaninotto's DependencyWheel visualization of dependencies, and decided to use it to build a nice diagram and add it to our documentation.
I thought it could be useful to others, hence this blog post to share the recipe online.
How ?
Following the spirit of "Modern Technical Writing" / "Literate programming" / "Living Documentation", our documentation for this project at work is written in Markdown and compiled with mkdocs to provide a static website. Moreover, the project is built & hosted by GitLab Pages.
This way, the diagram is always up-to-date with the project code. It also made the addition of this diagram quite easy:
- I added some code to the GitLab Pages build script to fetch the corresponding git repo and extract the modules dependencies as JSON.
- I added some Javascript code to a Markdown page in our documentation to render the dependency wheel based on this JSON
The script to extract the modules dependencies is on GitHub: gen_modules_graph.py. It is less than 100 lines and use the modulegraph package to parse modules dependencies, taking care to:
- ignore modules outside of the target project
- ignore constants, functions and modules with the zero incoming & outgoing dependencies (like Python packages with an empty
__init__.py)
Usage example:
gen_modules_graph.py ansible.inventory.manager ansible.playbook ansible.executor.task_queue_manager > modules-ansible.json
For the rendering, I used fzaninotto/DependencyWheel, originally written to display the external dependencies of a project (e.g. links between PHP composer packages). I made 2 small patches / PRs to the latest version of this project:
- a single-line code change to allow for colors customization
- another minor change to make the chart adaptive to the parent DOM element width
I also used some additional JS code to:
- ensure the dependencies matrix is square (to get prettier graphs)
- customize the colors (cf. below)
- add HTML anchor links
The code is available in this page source. Like the Python script, you are free to reuse it at will.
It is relatively straightforward, with a single notable trick: the conversion from a Python module path to a hue color value on a 360 degrees scale.
A little bit of maths
In order for modules with a shared ancestor to have close colors (like http.response.html and http.response.text in the scrapy wheel above),
I used a simple mathematical concept: decomposing the hue value with a bijective numeration
into a fixed-size string of digits.
This idea is similar to the binary numeral system, notably with the same concept of most / least significant digits,
except that the final range covered is [0, 360] and we want as many digits as the module tree depth.
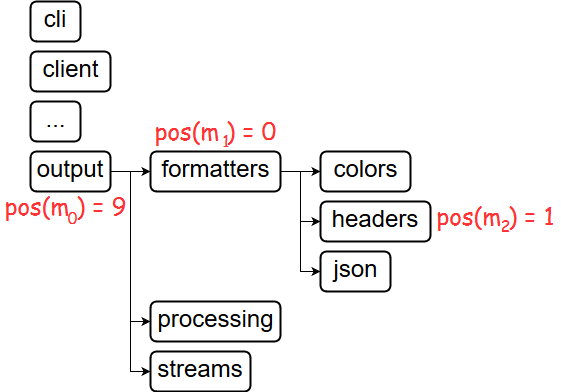
Once this numeral system base radix is computed from those 2 constraints, computing the hue value is simply a matter of a basic exponentiation :

output.formatters.headers of httpie
(made with draw.io - source xml)
`"Let's consider a module tree of depth " D "."` `"Then the base radix to use in our decomposition is " R = 360^(1 / D)` `"Now, let " m " be a module path, constituted of " d " modules names " m_i ", with " d <= D "."` `"We can define " pos(m_i) " to be the position of the module name " m_i " in the sorted list of its parent module children,"` `" and " parentModCount(m_i) " to be the number of children modules for its parent."` `"We can now compute the digits of " m " in our decomposition: " d_(m_i) = (pos(m_i)) / (parentModCount(m_i)) * (R - 1)` `"And then " hue(m) = sum_(i=1)^D d_(m_i)*R^(D-i)`


