
On this site you will learn data visualization with Python. You will find code examples of Python graphs made with matplotlib, seaborn, plotly and other packages
Parce que la police est une force publique, au service de tous et soumise au regard de tous, Mediapart propose de data-visualiser une partie de ses pratiques. Avec Allô Place Beauvau, il s’agit de documenter les pratiques policières dans le cadre du maintien de l'ordre de manifestations revendicatives (gilets jaunes, retraites, pompiers, lycéens) mais aussi un certain nombre de cas de violences policières avérées ou suspectées hors manifestation. Allô IGPN est une radiographie du travail de la police des polices.
Une collection proposée par David Dufresne, Etamin Studio, WeDoData, Visionscarto et l’équipe de Mediapart.
En quarante-trois ans, 676 morts à la suite d’interventions policières ou du fait d’un agent des forces de l’ordre
Une analyse claire, détaillée et visuelle des données publiques issues du grand débat national.
Le code source en Python de Myriam Begel : https://gitlab.begel.fr/myriam/grand-debat
En parallèle, l'analyse du site du gouvernement :
https://www.gouvernement.fr/on-fait-le-point-sur-la-restitution-du-grand-debat-national
The TOAST UI Grid is a component that can display, edit, add, and delete multiple data.
You can append units to the data shown and use html to represent images and links instead of textual data.
you can use tree data to represent them in a hierarchy
pyecharts is a wrapper around echarts, a library developped by Baidu [...] the gallery, it is quite impressive.
The Python wrapper used some technics such as modules to automatically converts Python code into Javascript:javascripthon.
A wordcloud/wordmesh generator that allows users to extract keywords from text, and create a simple and interpretable wordcloud.
Why word-mesh?
Most popular open-source wordcloud generators (word_cloud, d3-cloud, echarts-wordcloud) focus more on the aesthetics of the visualization than on effectively conveying textual features. word-mesh strikes a balance between the two and uses the various statistical, semantic and grammatical features of the text to inform visualization parameters.
Features:
- keyword extraction: In addition to 'word frequency' based extraction techniques, word-mesh supports graph based methods like textrank, sgrank and bestcoverage.
- word clustering: Words can be grouped together on the canvas based on their semantic similarity, co-occurence frequency, and other properties.
- keyword filtering: Extracted keywords can be filtered based on their pos tags or whether they are named entities.
- font colors and font sizes: These can be set based on the following criteria - word frequency, pos-tags, ranking algorithm score.
Rough.js is a light weight (~8k), Canvas based library that lets you draw in a sketchy, hand-drawn-like, style. The library defines primitives to draw lines, curves, arcs, polygons, circles, and ellipses. It also supports drawing SVG paths.
Les éditeurs « classiques » [d'articles scientifiques] ont auss réagi par rapport au libre accès. Toutes sortes « d’exceptions » ont été mises en place. Par exemple pour la revue Artificial Intelligence In Medicine (édité par Elsevier) où j’ai publié :
- les auteurs peuvent payer pour avoir leur article en libre accès (N. B. : hors de prix, mais certains projets de recherche, notamment européen, exigent que ce soit le cas) ;
- un lien est fourni aux auteurs qui permet de télécharger gratuitement l’article pendant 50 jours, et ce lien peut être diffusé à volonté ;
- après six mois d’embargo, une « version auteur » (même contenu que le vrai article, mais sans la mise en forme de l’éditeur) peut être mise à disposition librement sur des serveurs comme HAL (Hyper‐Archives en Ligne) ;
- les auteurs ont le droit de mettre une « version auteur » sur leur site personnel dès la parution de l’article, sous licence Creative Commons Attribution Non‐Commercial No Derivatives ».
En commentaire, de chouettes visualisations d'ontologies OWL en ligne : https://hal.archives-ouvertes.fr
Used by Upian : https://www.upian.com
PARLONS TRAVAIL est une programme interactif produit par la CFDT, Upian et Yami2. Il s’agit d’une enquête sur le travail, ouverte à l’ensemble des travailleurs et des anciens travailleurs de France.
Passionnant sondage national, avec une analyse des résultats très réussie en termes de rendu web
Simple charts based on jQuery & Raphaël
GitHub-inspired simple and modern charts for the web with zero dependencies.
These structures were uncovered from leaked financial documents and were analyzed by the journalists. They extracted the metadata of documents using Apache Solr and Tika, then connected all the information together using the leaked databases, creating a graph of nodes and edges in Neo4j and made it accessible using Linkurious’ visualization application.
In this post, we look at the graph data model used by the ICIJ and show how to construct it using Cypher in Neo4j. We dissect an example from the leaked data, recreating it using Cypher, and show how the model could be extended.
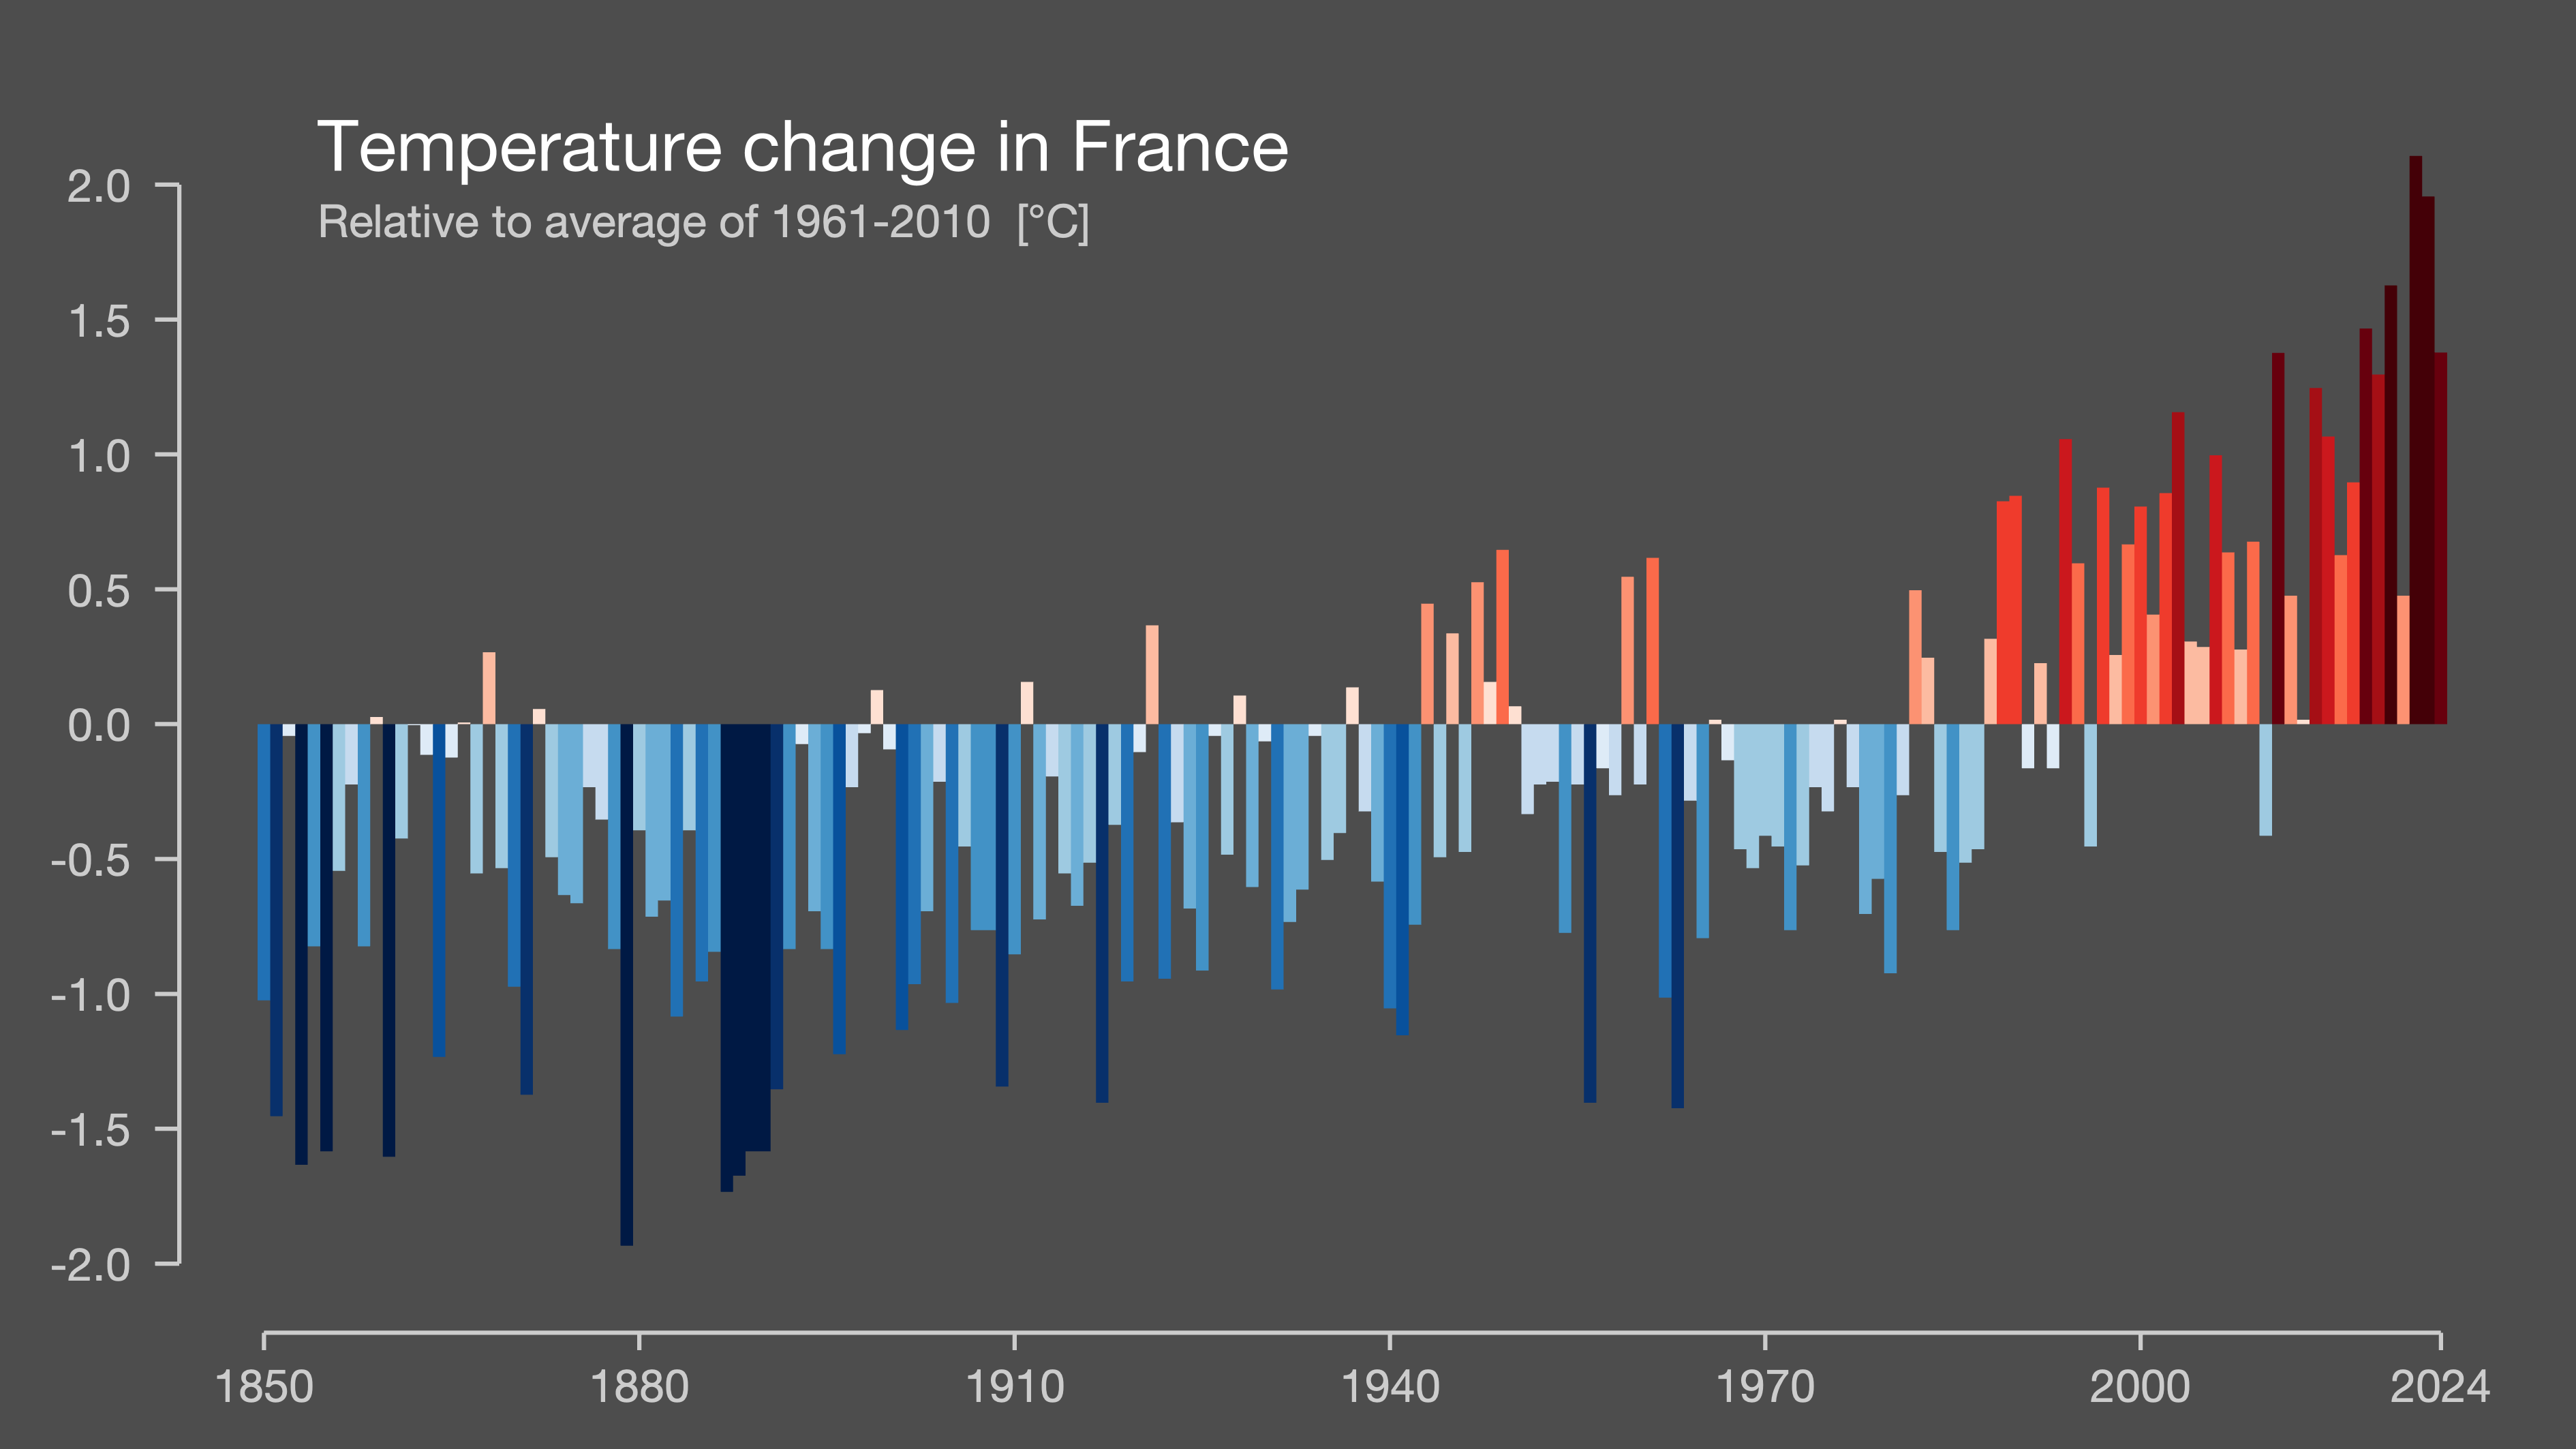
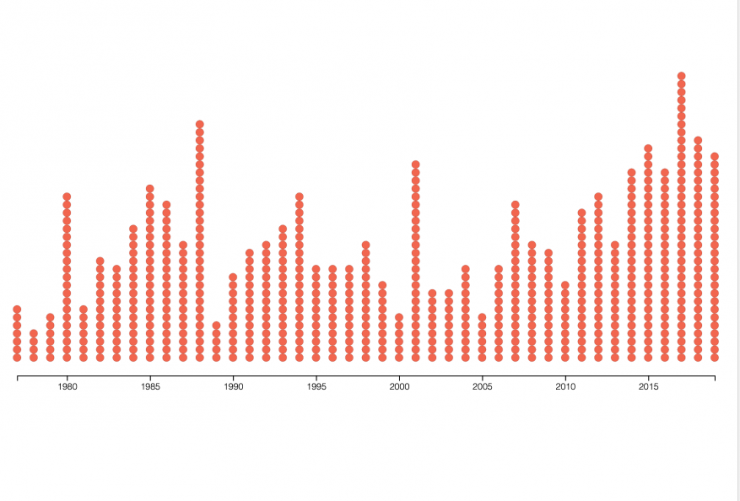
Using Python’s matplotlib and pandas, we’ll see that it’s rather easy to replicate the core parts of any FiveThirtyEight (FTE) visualization.